
Crowdsourced Security Cameras Enabling a Real-time Scaled Response to Crime
OVERVIEW

Motivation
City Paterson is going to solve the crime problems by using Crowdsourced Security Cameras and collaborative policing. The city has always been handling the relatively high crime rate compared with other cities in NJ.
In the meanwhile, due to the current COVID-19 situation, another type of violation-social distancing violation surges. Paterson wants to properly place and utilize cameras to kill two birds with one stone which means placing the camera appropriately which can both detect crime and social distance violation.

Goal
1.Find out where to install those cameras by overlapping the city crime and COVID-19 response call data
2. Develop a Yolo-based model to detect social distancing and blank frame (no person in the frame)
3. Allocate the police force temporally and spatially based on data analytics and modeling
DATA

Crime Arrest data
From 2015-2020 in Paterson
Location
Time
Crime type
COVID-19 response call data
From April 2020 to June 2020 in Paterson
Call time
Location

Shapefile of Paterson Census Tract(2010)
Geometric information about each contract such as geoid, boundary, latitude, and longitude.

Camera Footage
Provided by Mayor Office Chief Executive of Innovation.
Genes Liquor Store
Brother Groceries
METHODOLOGY
Crime data for clustering
Summarizes detailed crime types into a more general one.
Calculate the number of each crime type incident by each hour and normalize all the incident numbers.
So the absolute number becomes relative numbers so the team can observe the proportion easily, which is also a prerequisite for clustering.
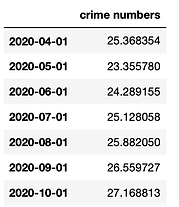
Crime data for Time-series Analysis
1, Join the census tract map and crime data to get the merged data.
2, Calculated the total incidents each month in each census tract as the time-series analysis input.
3, Predicted the incidents number in the following 3 months by different tracts and selected the top 5 high-risk areas.
RESULT & CONCLUSION
Clustering
The final 3 categories have different time distributions. For label 0, it reaches a peak at midnight and stays quite low during the day. Label 1 has the highest point around 7 am-9 am which is just the start of the working. As for label 2, it keeps rising until the afternoon and remains quite high until night. After having a basic understanding of these 3 patterns, the team investigates the detailed crime types.

Clustering Results
Time-series analysis

ABOUT US
OUR TEAM


Pengcheng Yang
Master student at NYU Center for Urban Science + Progress
Jianan Gong
Master student at NYU Center for Urban Science + Progress
OUR SPONSOR & MENTOR
Edward Boze
Chief innovation officer of Paterson
Junaid Ahmed Khan
Smart Cities Research Associate at Center for Urban Science and Progress (CUSP), New York University